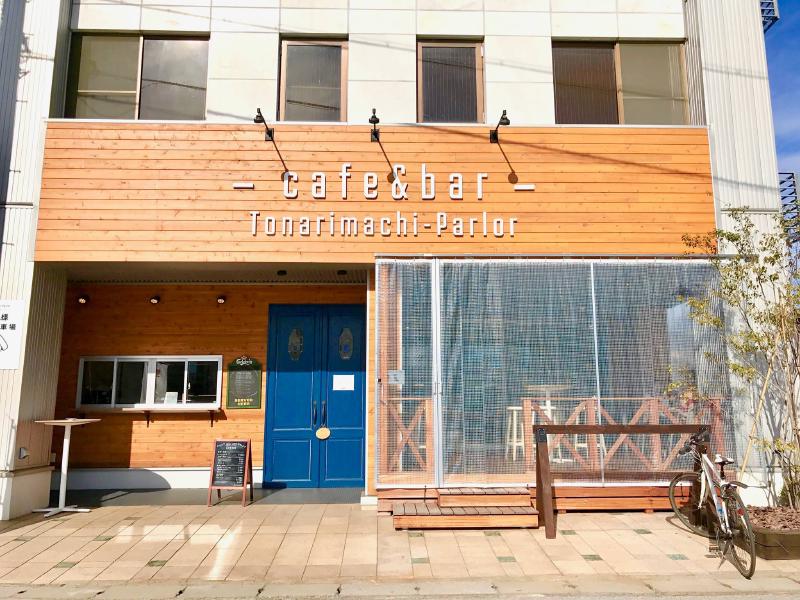
In April 2017, I spoke at “Tips for Designers Working with Data, with a Co-Author of The RESAS Textbook,” an event for regional designers and creators held at Tonarimachi Parlor near Maibara Station. It was organized by the International Affairs Office of Shiga Prefecture’s Department of Commerce, Industry, Tourism and Labor.
The event focused on the Regional Economy and Society Analyzing System (RESAS), an important resource for regional revitalization, and the growing field of data visualization.
Main Topics
- Foundations of data use: Practical advice on creating, preparing, and handling the data behind a visualization.
- The nature of data visualization: Discussion of how it differs from infographics and the value visualization can bring to a region.
- What makes RESAS interesting: Insights into the system’s possibilities, informed by my experience as a co-author of The RESAS Textbook.
The event coincided with the establishment of Shiga University’s Faculty of Data Science and contributed to improving regional data literacy and encouraging data use in creative practice.
- Event: Tips for Designers Working with Data, with a Co-Author of The RESAS Textbook
- Date: Saturday, April 15, 2017
- Venue: Tonarimachi Parlor, Maibara, Shiga
- Theme: Data visualization and the use of RESAS
- Speakers: Yuichi Yazaki and others